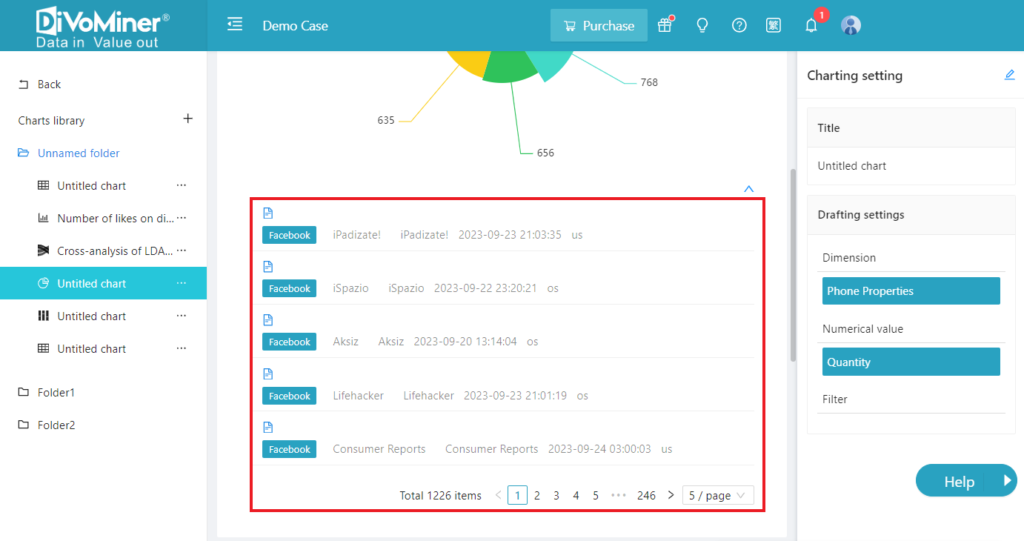
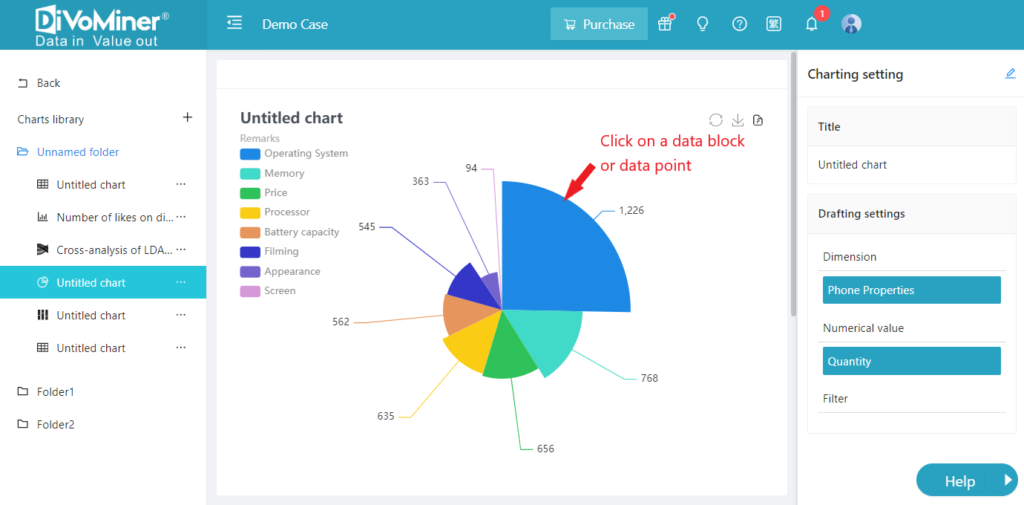
The DiVoMiner platform allows for convenient viewing of source data in statistical charts. In modules such as [Coding Result], [Basic Statistics] and [Algorithm & Mining], you can click on a data block or data point in the saved charts. The source data for that point will appear below the page. You can scroll down to view the data list and click on links to see data details.
Related Articles
-
How to assign a certain amount of data to a coder? Operation of [Coding Task Allocation]
- 0
- 108
-
Should I choose manual coding or machine coding?
- 0
- 119
-
How do I upload a video (link)? What should I do if the video link cannot be parsed?
- 0
- 111
-
How to create a database? –data uploading
- 0
- 131
-
How to upload an Excel document? What should I do if the upload fails? Date field
- 0
- 110
-
How do computing resources count “points”?
- 0
- 136