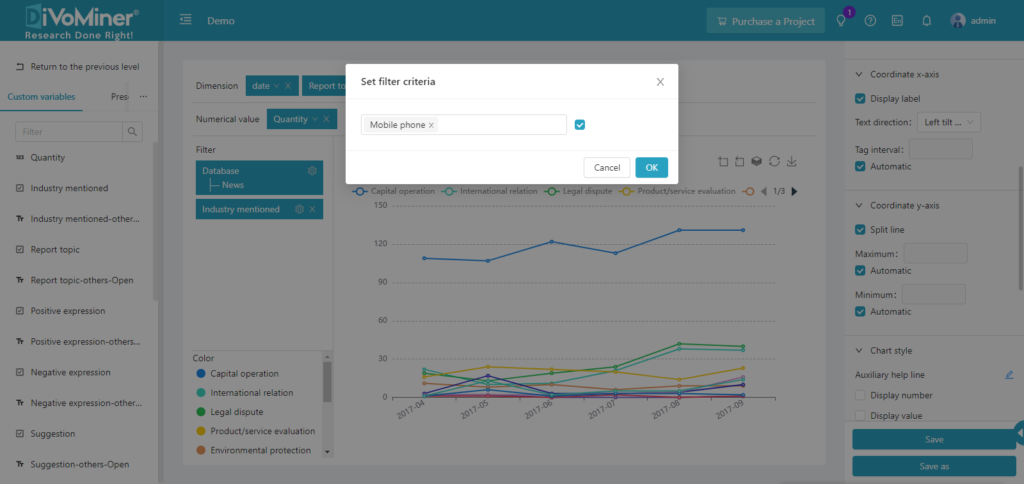
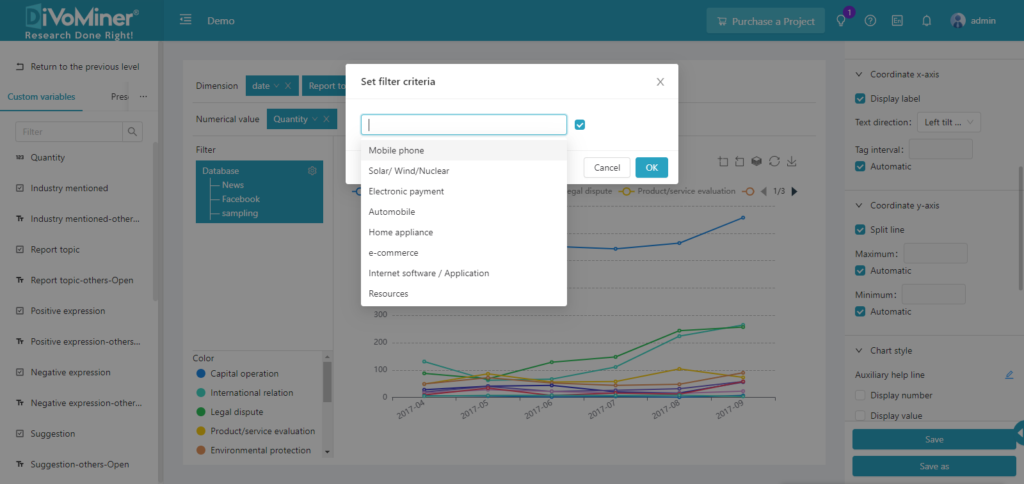
During statistical analysis, sometimes you need to analyze a specific scope of data with specific filter conditions. On the DiVoMiner® platform, you only need to drag the variable to the [Filter] section; set corresponding criteria through [Condition Setting], and click [Confirm].
Variables/fields in [Custom Variables], [System Variables], and [Algorithm Variables] can all be placed in the [Filter] area, and multiple conditions are allowed for filtering.
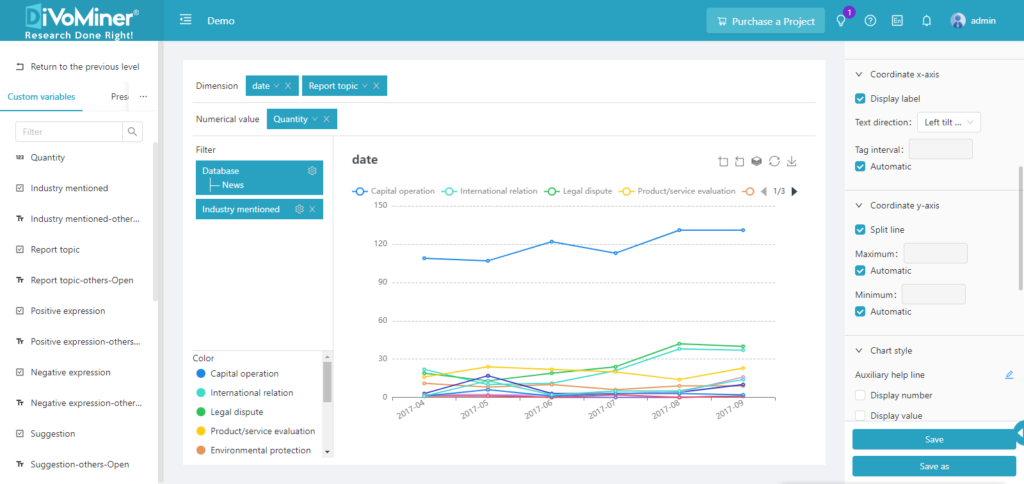
After editing the chart, click [Save] to save the chart to a folder.
Note: The data in the sampling pool is mixed in the overall database, so if the statistical analysis chart is only for sample data, you need to specify the data with [Filter] function, to set the data scope for statistical analysis.