Correlation analysis investigates the interrelation between two or more equipollent random variables, aiming to delineate the extent of their mutual association, direction, and proximity.
Operating Method
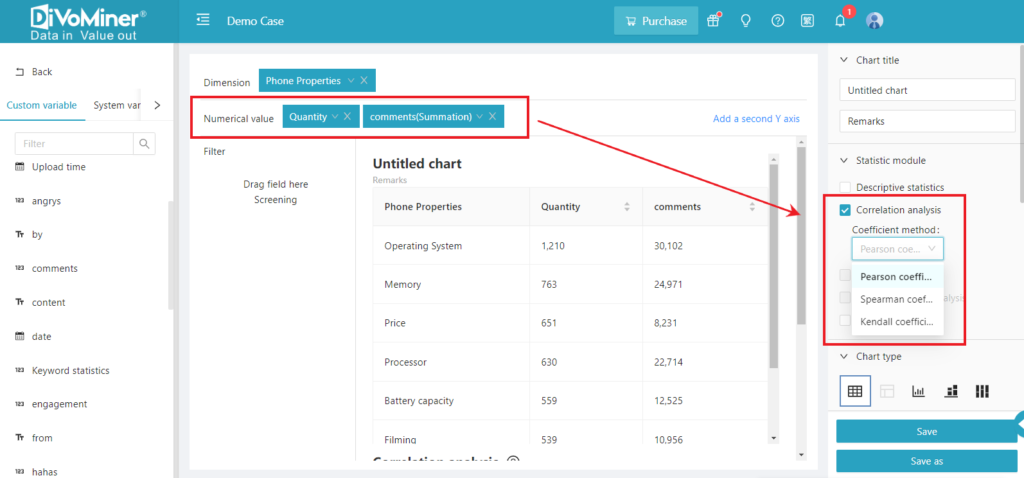
In [Statistical Analysis] – [Basic Statistics], click the “+” sign to create a new chart. On the chart editing page, drag two quantitative variables into the [Numerical Value] column. Ensure that the data calculation method is set to “Summation” (note: the default is “Count” and needs to be manually adjusted to “Summation”). Meanwhile, include a categorical variable in [Dimension] column (for statistical analysis reference only and will not be included in the correlation analysis results). Check the box on the right for [Correlation Analysis] and select a statistical coefficient to calculate the correlation between the variables based on the specified dimensions.