
DiVoMiner provides a variety of mathods for users to have an overview of the coding results. The easiest and fastest way is to check the coding results of various categories in the [Coding result] section with univariate analysis (descriptive data). Click the category title in the middle of the page, and the coding results of the corresponding category will be displayed on the right.
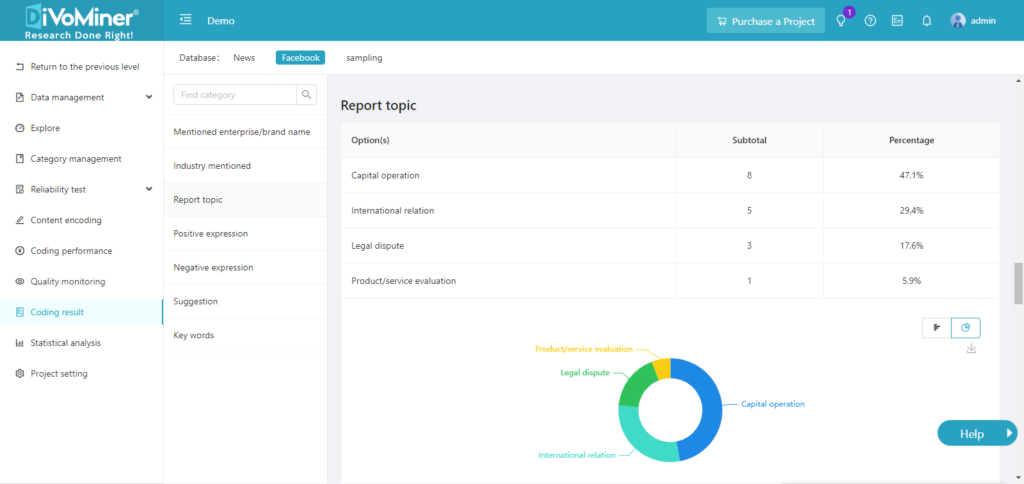
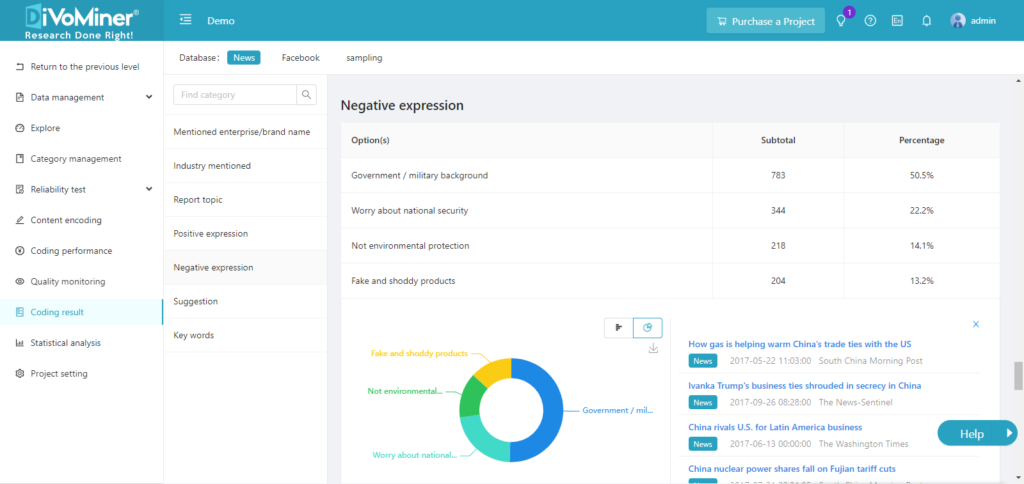
Under the data result table is the corresponding chart , which can be presented either as a bar chart or a pie chart. Users can click on a category on the chart, and detailed data sources of this category will be listed on the right side of the chart.
The [Coding Results] section presents univariate descriptive data results for a single database and all categories. To view cross-database analysis, more statistical analysis results and visual charts (multivariate analysis), create custom charts in the [Statistical Analysis] section.
Click to view operation of [Basic Statistics]
Click to view operations of regression analysis (univariate and multivariate) and advanced statistics