
The DiVoMiner platform provides two options for viewing data results: [Coding Result] and [Statistical Analysis].
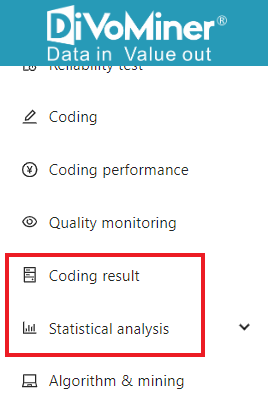
[Coding results]
View univariate analyses and descriptive data results of coding results under a single database.
Click here to see how to have a quick look at the coding results
[Statistical Analysis]
Create and view results of customized statistical analyses and visualized chart, such as word clouds and multivariable analyses.
Click here to access the fundamental usage of [Statistical Analysis]
Click here to learn how to create univariate analysis charts (tables, bar graphs, pie charts, radar charts, etc.)
Click here to learn how to create customized word cloud