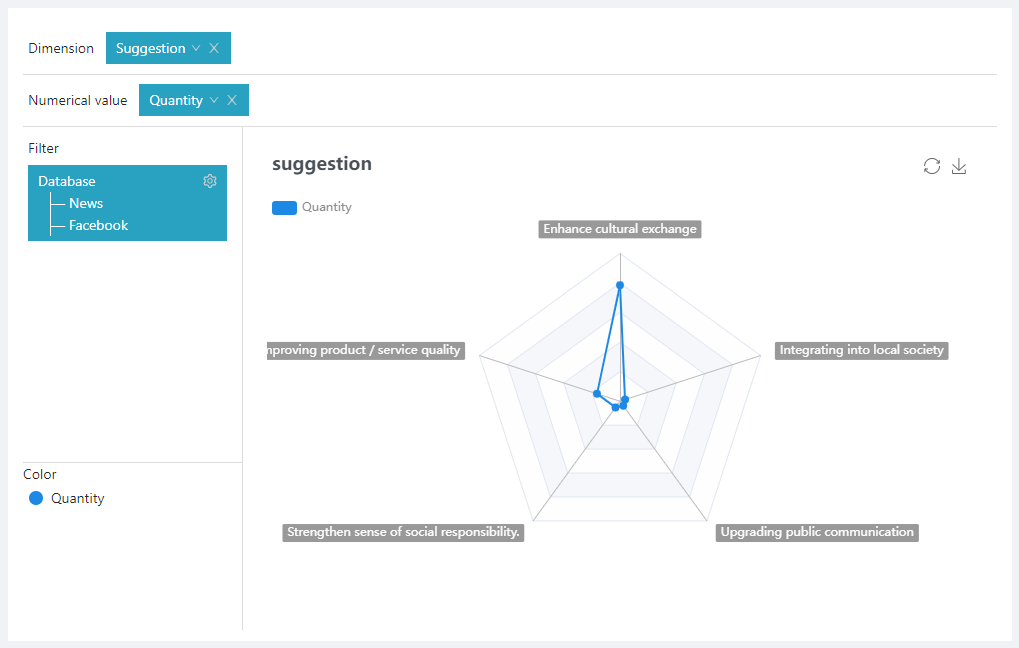
Radar chart, also known as Debra chart or Spider chart, is a graphical method that is often used in financial analysis report. In a Radar chart, the numbers or ratios obtained from the various financial analysis of a company are put on a circular chart, to show the financial situation of a company. Users can understand the changes and positive or negative trends of the company’s financial indicators at a glance. It is also commonly used to describe the overall situation of multiple indicators, or multiple indicators of one event with the time difference. Add variables with multiple indicators to the dimension field, and set corresponding numerical parameters, a circular radar chart can be obtained accordingly.
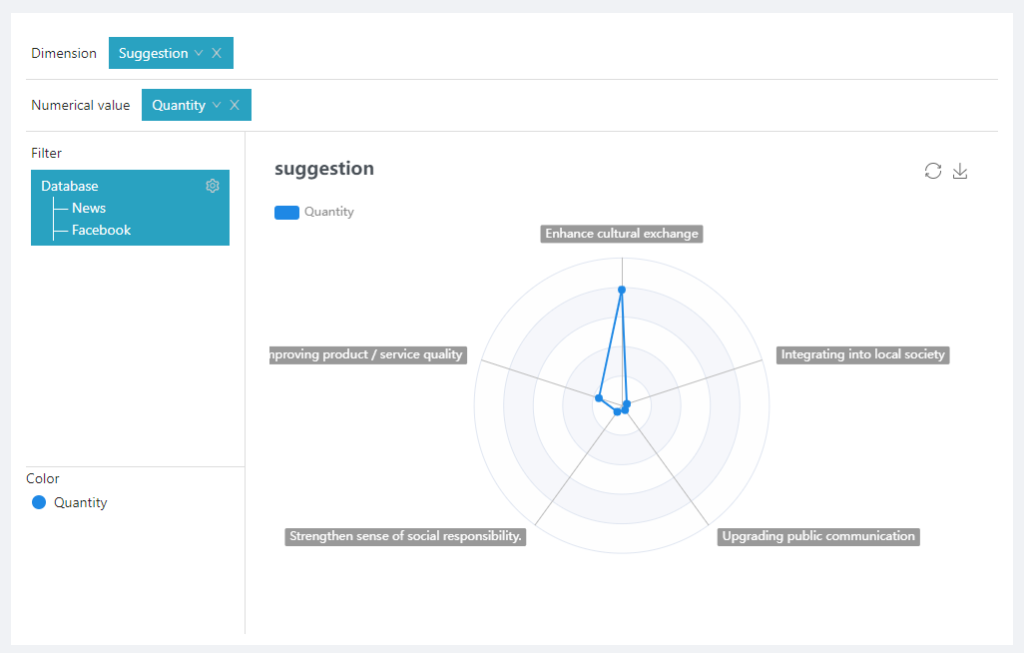
Polygon Radar chart: another type of radar chart is called Polygon Radar chart, as shown in the chart below.