
- Summary
Linear regression is a basic and commonly used type of predictive analysis. The basic idea of regression is to examine two things: (1) does a set of predictor variables do a good job in predicting an outcome (dependent) variable? (2) Which variables in particular are significant predictors of the outcome variable, and in what way do they impact the outcome variable (indicated by the magnitude and sign of the beta estimates)? The situation with only one independent variable is called univariate linear regression, and the situation with more than one independent variable is called multiple linear regression. Linear regression is usually used for predictive analysis and is widely used in Economics, Medicine, Industry and other fields.
2. Detailed introduction
(1) Model introduction
① Regression analysis method
Ⅰ. In statistics, a functional relationship is used to present the relationship between the dependent variable and the independent variable, and it is called the regression equation (for the sample) or the regression model (for the whole). Regression analysis usually includes the construction of regression equations, hypothesis test and interval estimation of its regression coefficients (that is, the law of inferring the population from the sample, in essence to obtain or get close to the regression model). The ultimate goal is to predict the value of the dependent variable based on the new value conditions; in a few occasions, the value of the dependent variable will be given, and the value range of the independent variable can be obtained.
II. Regression analysis is divided into unary regression and multiple regression according to the number of variables involved. According to the relationship between the independent variable and the dependent variable, it can be divided into linear regression analysis and nonlinear regression analysis.
② .Formula
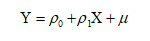
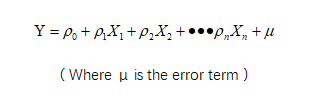
A regression equation established between the dependent variable (Y) and one or more variables (X).
Unary regression:
Multiple Regression:
③. Index description
R-squared:The Coefficient of determination, R-squared, is used to analyze how differences in one variable can be explained by a difference in a second variable. To measure how the regression model fits the observed value of the sample. The value range is 0-1. The closer the value is to 1, the more fit of the model.
Adjust R-squared:The Coefficient of determination, R-squared, is used to analyze how differences in one variable can be explained by a difference in a second variable, so it can be used to measure how the regression model fits the observed value of the sample. The value range is 0-1. The closer the value is to 1, the more fit of the model.
F:The F value is used to determine whether the linear relationship between the dependent variable and all independent variables in the model is significant overall.
AIC:The Akaike information criterion (AIC) is a mathematical method for evaluating how well a model fits the data it was generated from. The best-fit model according to AIC is the one that explains the greatest amount of variation using the fewest possible independent variables.
BIC:Bayesian Information Criterion is similar to AIC for model selection.
B:The regression model is significant when the coefficient (including intercept and slope significance) is less than the usual significance level of 0.05. The slope indicates the steepness of a line and the intercept indicates the location where it intersects an axis.
Standard error:The greater the standard error of the regression coefficient, the less reliable the estimated value of the regression coefficient.
t:Conduct a significance test on the independent variables to determine whether the variables will be retained in the model.
Sig:Significance, if 0.01<sig<0.05, the difference is significant, and if sig<0.01, the difference is extremely significant.
3. References
[1] Robinson, E. (2016). Introduction to Likelihood Statistics. Retrieved April 16, 2021 from: https://hea-www.harvard.edu/AstroStat/aas227_2016/lecture1_Robinson.pdf
[2] Kotz, S.; et al., eds. (2006), Encyclopedia of Statistical Sciences, Wiley.