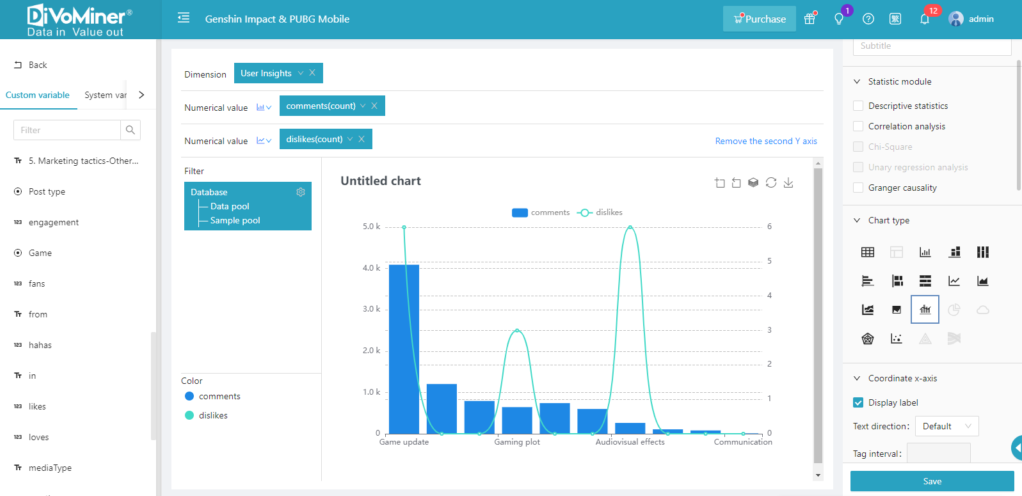
When there is a significant difference between two sets of data, it can be challenging to clearly visualize the small values on a chart. In this case, a biaxial chart can be used. A biaxial chart refers to a data chart with multiple (≥2) Y-axes, often combining bar and line graphs, resulting in a more intuitive representation. Apart from being suitable for analyzing two significantly different sets of data, biaxial charts are also ideal in scenarios involving different data trends and analysis of data on a month-to-month or year-on-year basis.