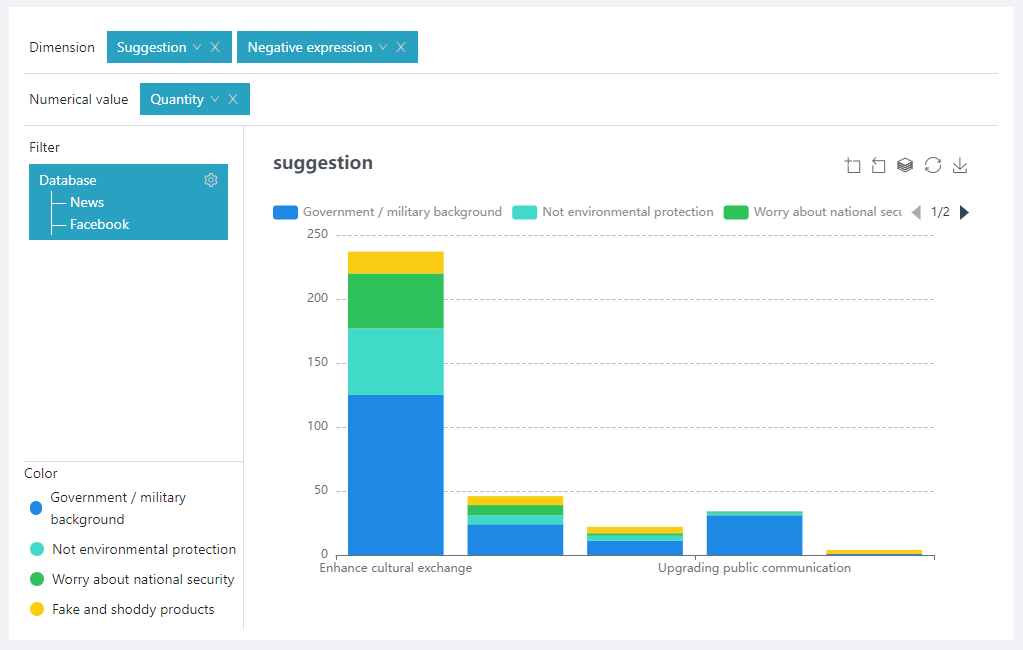
The Stacked graph is an extension of the vertical bar chart. The difference is that the data values of the column chart are arranged in parallel, while the stacked column chart is stacked one by one. It can display the total amount of each category, as well as the size and proportion of each small category included in the category, so it is very suitable for dealing with the relationship between part and the whole..