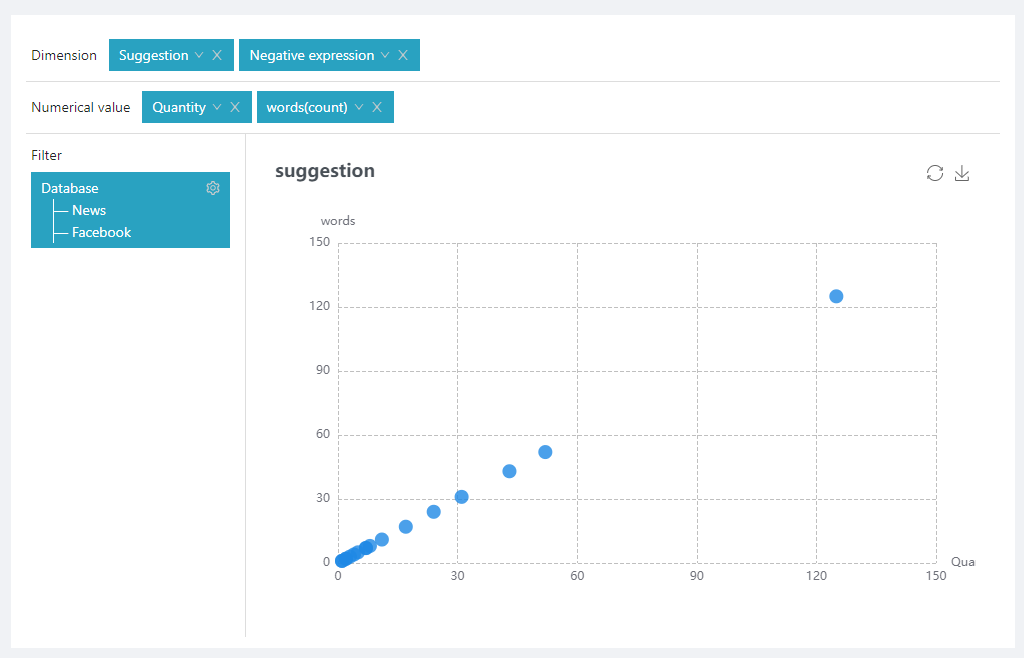
The scatter chart is a type of plot or mathematical diagram using Cartesian coordinates to display values for typically two variables for a set of data.. The scatter chart shows the general trend of the dependent variable changing with the independent variable. Based on this, you can select a suitable equation for the data point to fit. Use two sets of data to form multiple coordinate points; examine the distribution of coordinate points; observe whether there is a certain correlation between the two variables, or summarize the distribution pattern of coordinate points. A scatter chart displays the series as a set of points. The value is represented by the position of the point in the graph. As shown in the figure below: