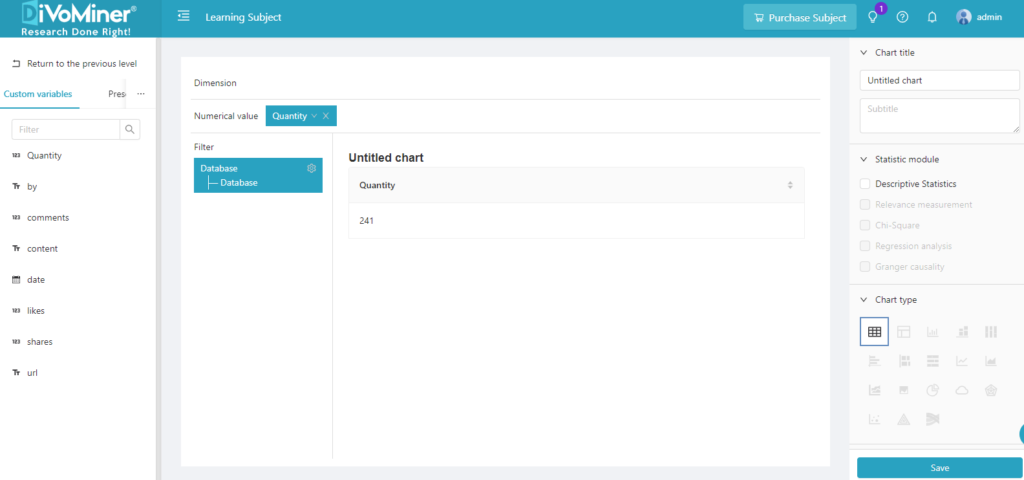
The Chart editing interface include three parts: the “Variable list area” on the far left, the “Chart editing area” in the middle, and the “Chart setting area” on the right.
Variable list
The variable list includes Customized Variables, and Default Variables. Customized Variables are from self-uploaded data with self-designed categories, such as coding results for various coding categories, etc. You can put any variable from the list into the chart editing area to generate the statistical chart as needed. The Default Variables are the variables in the original data set, such as the sample’s creator, modifier, whether the sample is machine-coded, etc.
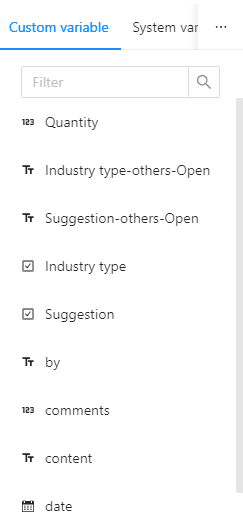
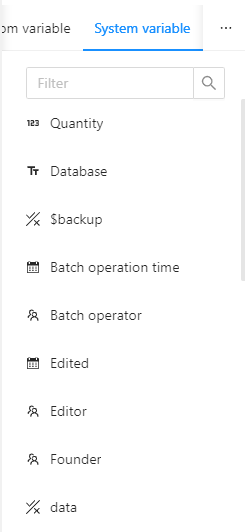
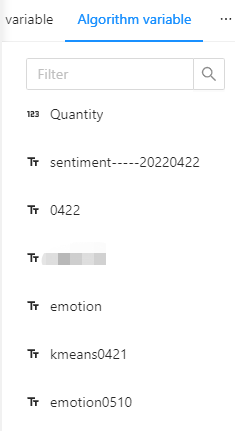
Chart editing
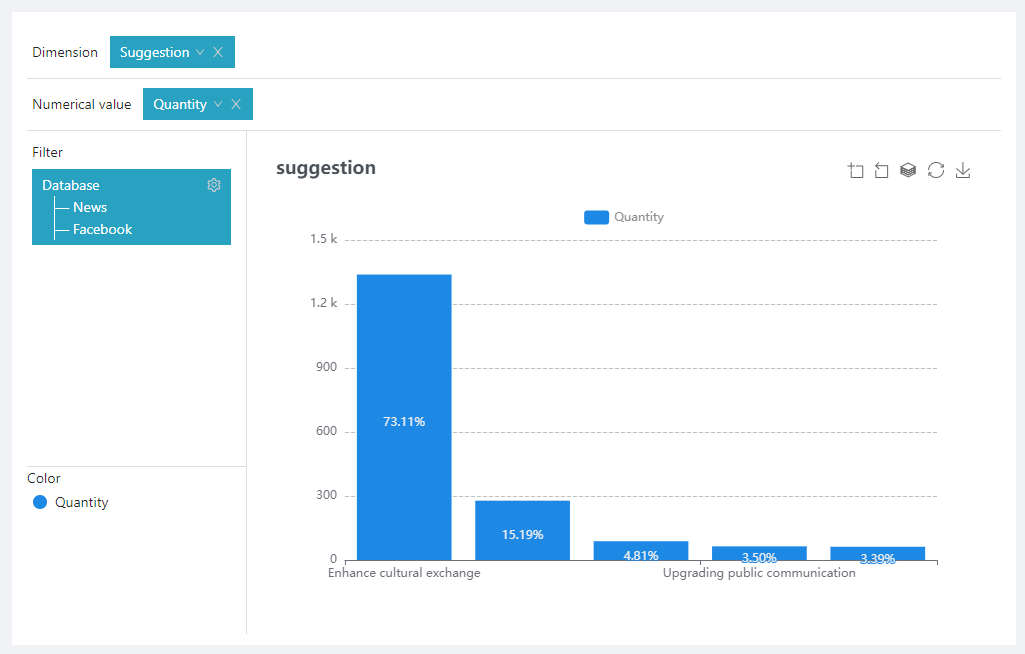
Chart editing area mainly consists of “Dimension”, “Value”, and “Filter”. The content that needs to be analyzed (e.g. coding categories) should be placed in the “Dimension” section, and the quantitative data (e.g. number of samples/counts) related to the content should be placed in the “Values” section, and the “Filter” can further narrow the scope of the data to be analyzed, for data screening purpose. For example, if you want to know the number of samples in different databases, first put “Database” in “Dimension”, and then put “Number (counts)” in “Value”.
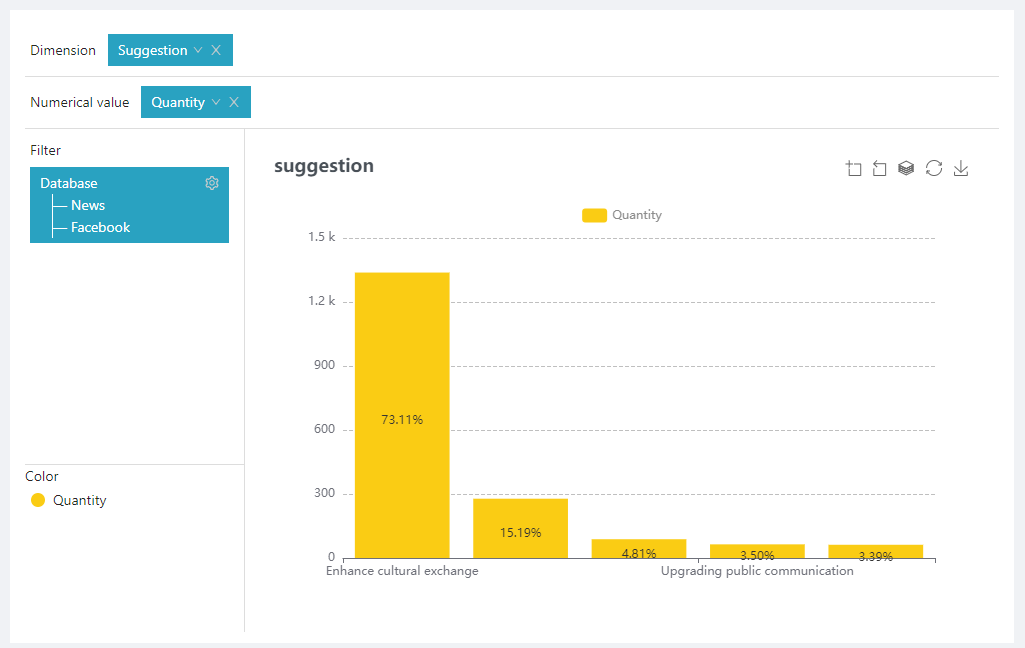
You can also adjust the Color setting, which is located at the lower-left corner of the graph.
Select the chart type to show data trends, proportion, etc.
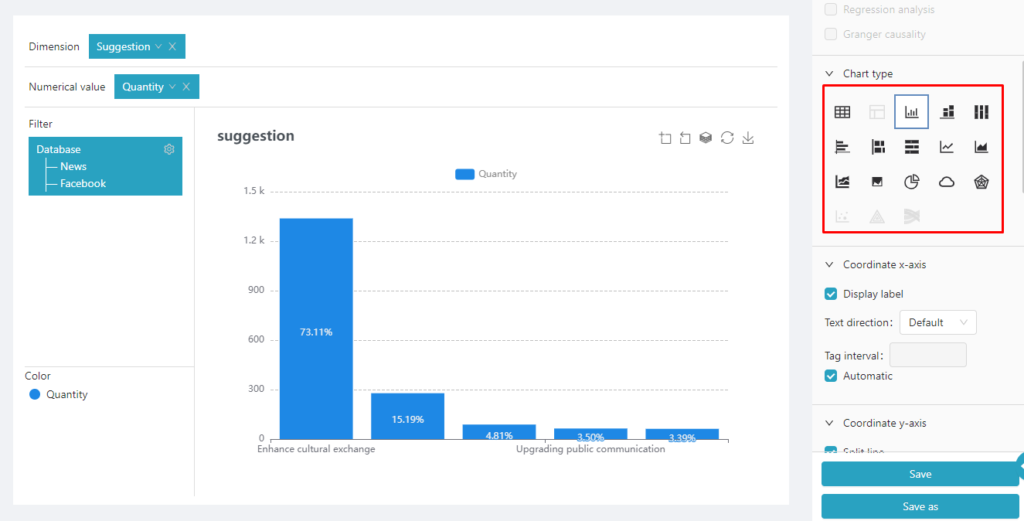
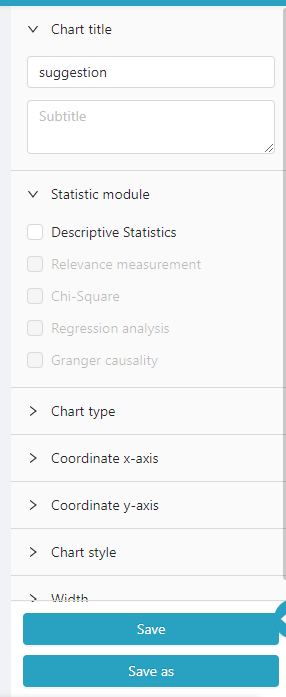
Chart setting
The “Chart setting” is composed of chart function settings such as “Chart name”, “Statistical module”, “Chart type” and “Chart style”. After completing the chart naming and chart type settings, click “Save” or “Save as” button at the bottom of the page to save the chart settings.