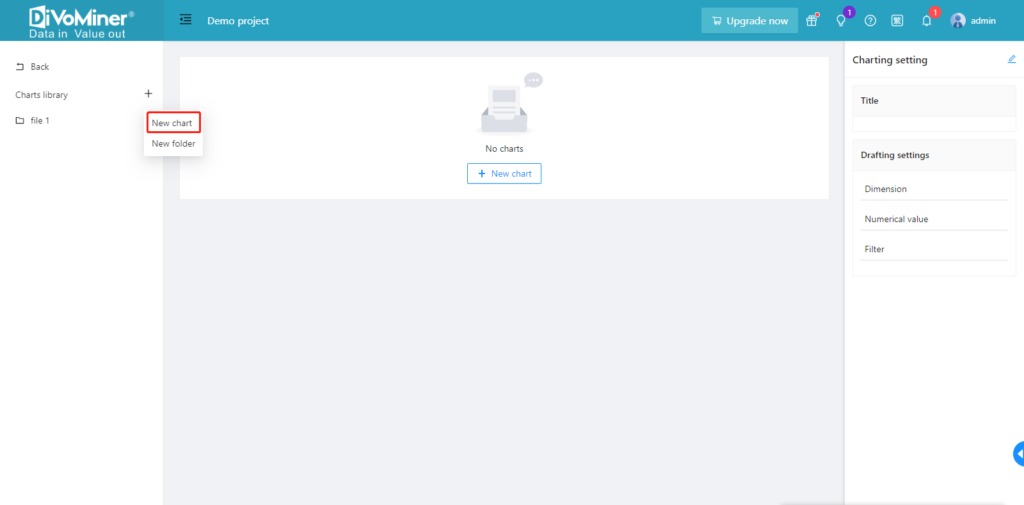
1. Create a chart
On the Statistical analysis page, users can customize statistical analysis charts according to their own needs, including tables, bar charts, line charts, etc. The chart created can be saved permanently. Click “+” beside the Chart library and select “New chart” to create a new chart.
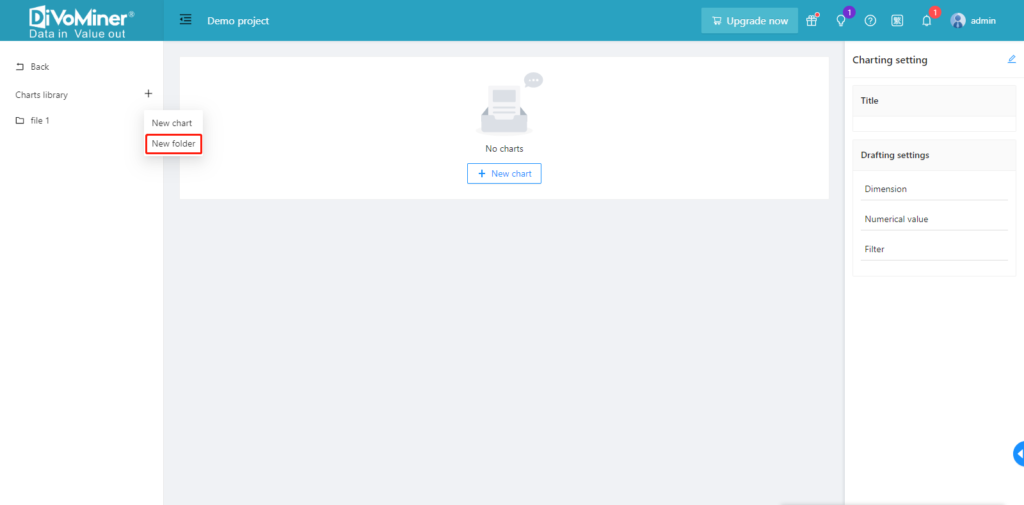
2. Create a folder
Click “+” beside the Chart library and select “New folder”, and a new folder is created under the Chart library.