
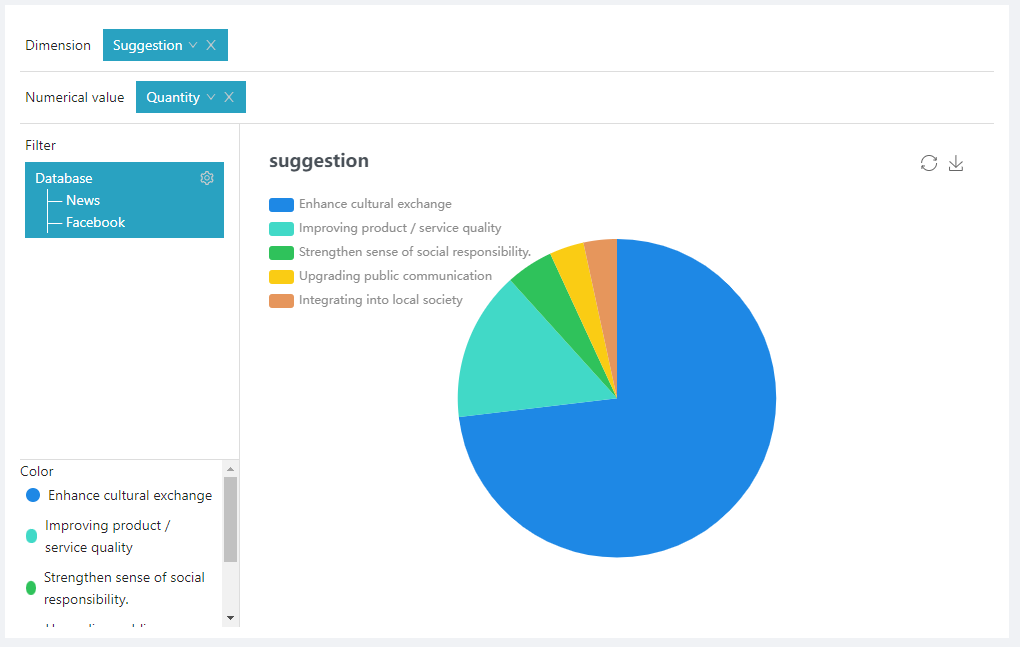
A pie chart must have one dimension and one value. In the following graph, put “suggestion” in the “Dimension” field, and “Quantity” in the “Value” field, to present the number of suggestion.
Pie Chart: There is another type of pie chart, namely the “Ring Chart”, as shown in the graph below.
