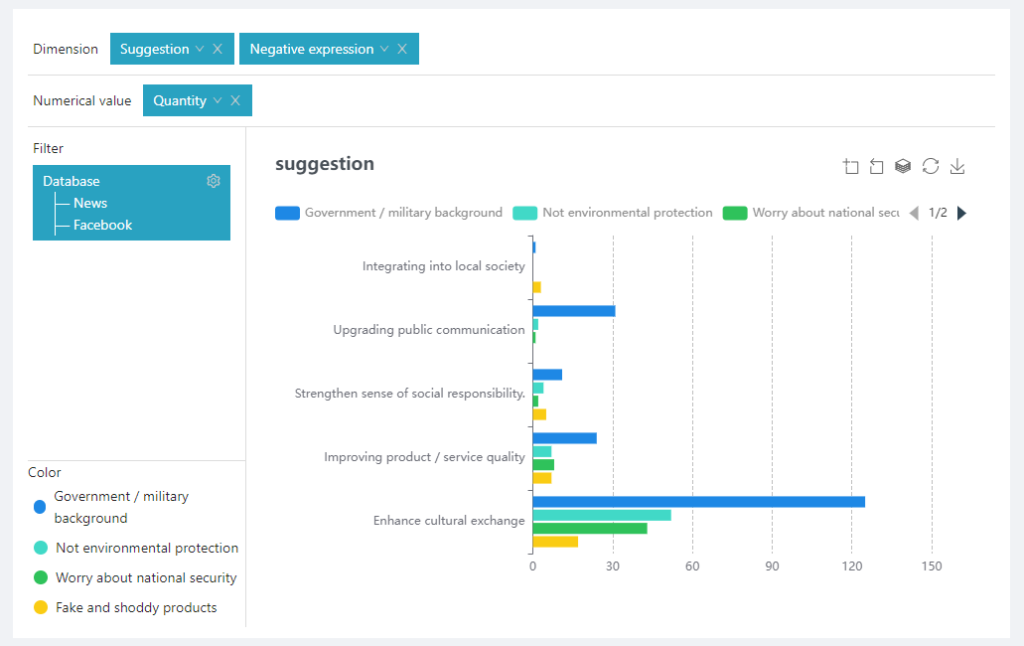
Bar graph is a statistical chart that uses the width of a rectangle as a variable to describe the graph. A series of horizontal stripes with different widths represent the data distribution. You can choose none or only one dimension, and one or more values.