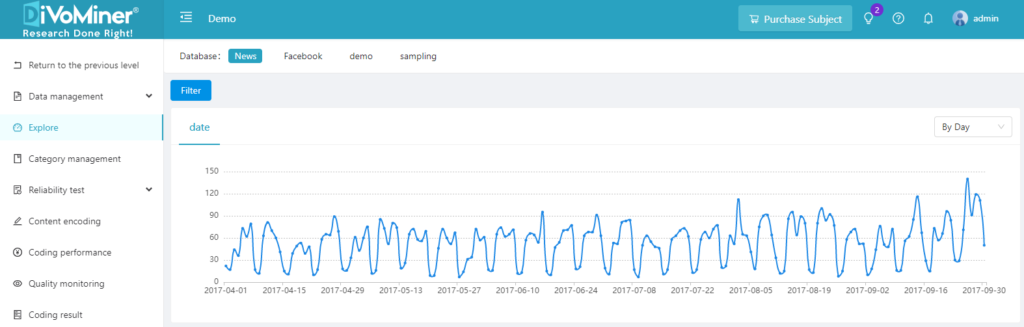
Data exploration is to generate visualized charts real-time with online textual analysis and calculations. In this section, you can have a quick check of the data volume (number of samples) based on the data uploading time, or the data source date (by day, month, or year, as previously set in the data type field). And you can view the Word Cloud image and detailed content of the uploaded data. To display some amount of data with certain criteria, you can set filter criteria according to your needs.
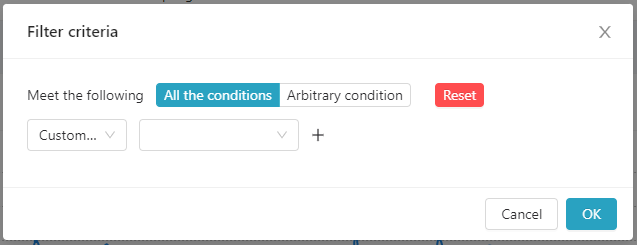
For example, if you want to display the data that contains the words “child abuse” in the title field of your text data, set the filter criteria as follow:
The Word Cloud image shows some keywords of the uploaded text in the form of a word cloud.
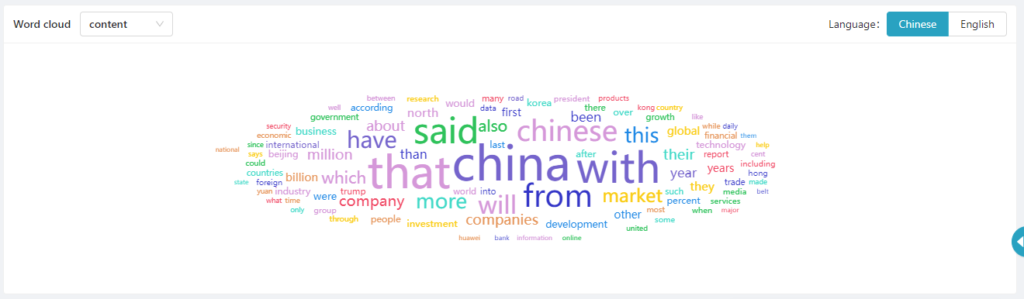
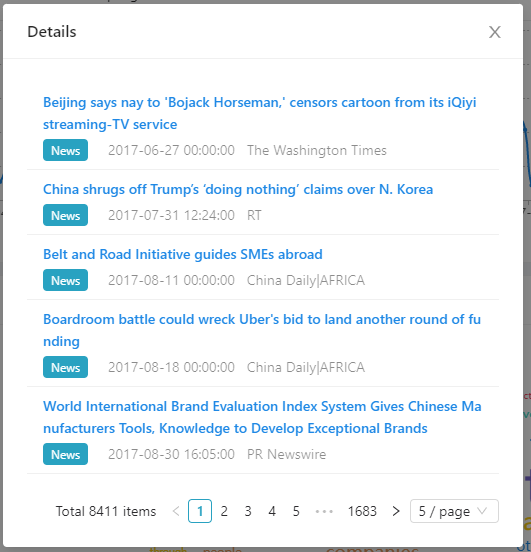
Click on a keyword in the Word Cloud to view all content data about that keyword.
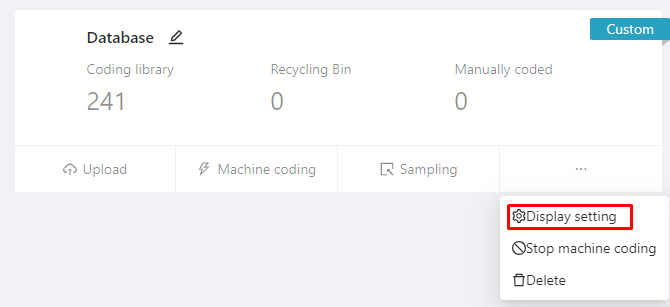
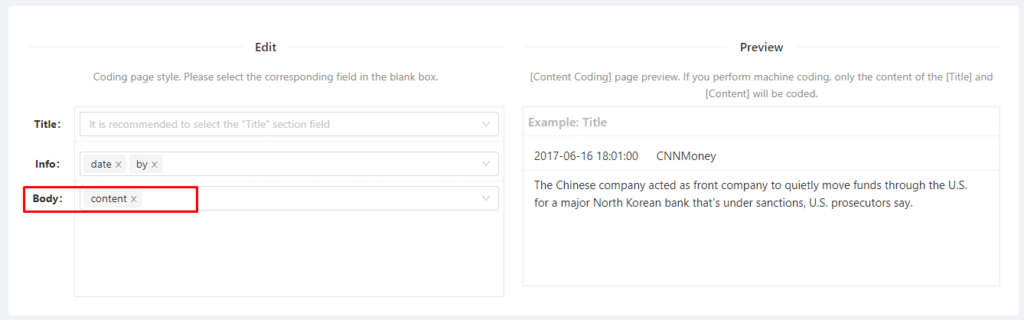
Note: If you need to display the word cloud image, it is necessary to set up the data field in the Text section when you upload or configure the data. To set up the data field, go to Overview page and click “Display Settings” on the lower right corner of the corresponding database.