
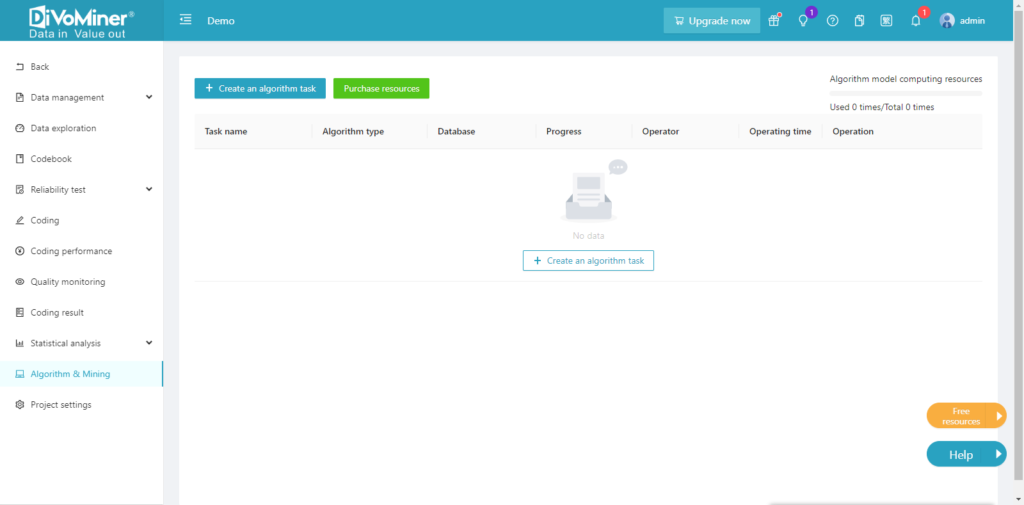
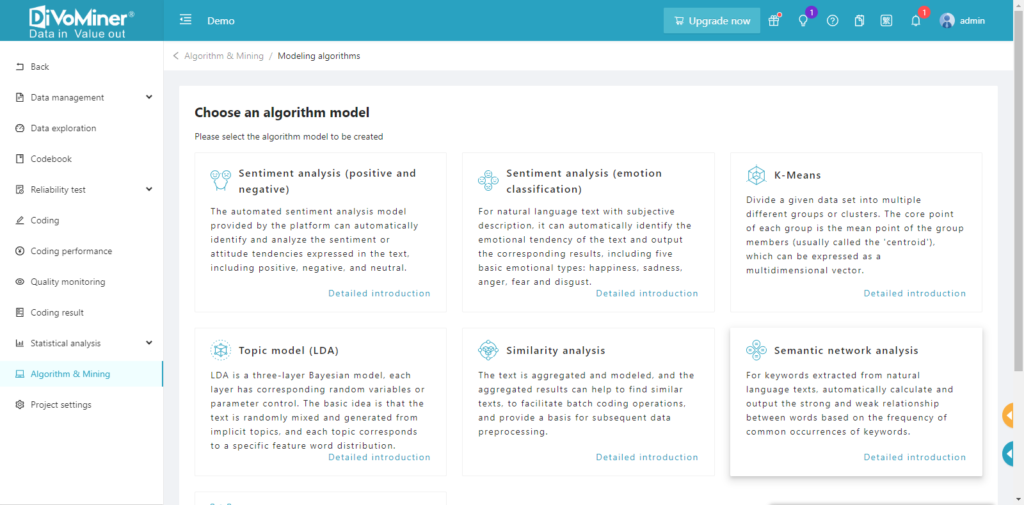
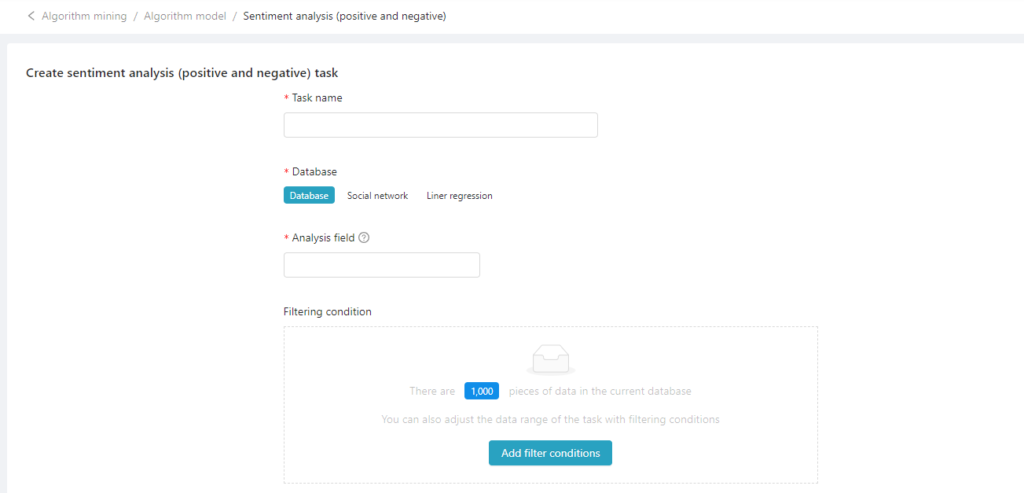
- 1. Create a new sentiment analysis: click “Statistical analysis”; enter the Mining algorithm page; click “Create an algorithm” task; select sentiment analysis (positive and negative), and edit the content of the corresponding field according to the page instructions.
Note: If the algorithm quota is insufficient for the algorithm and model task, you need to purchase the algorithm quota before executing the algorithm task.
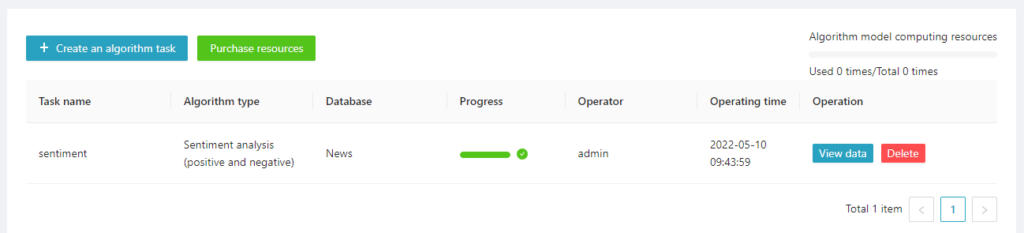
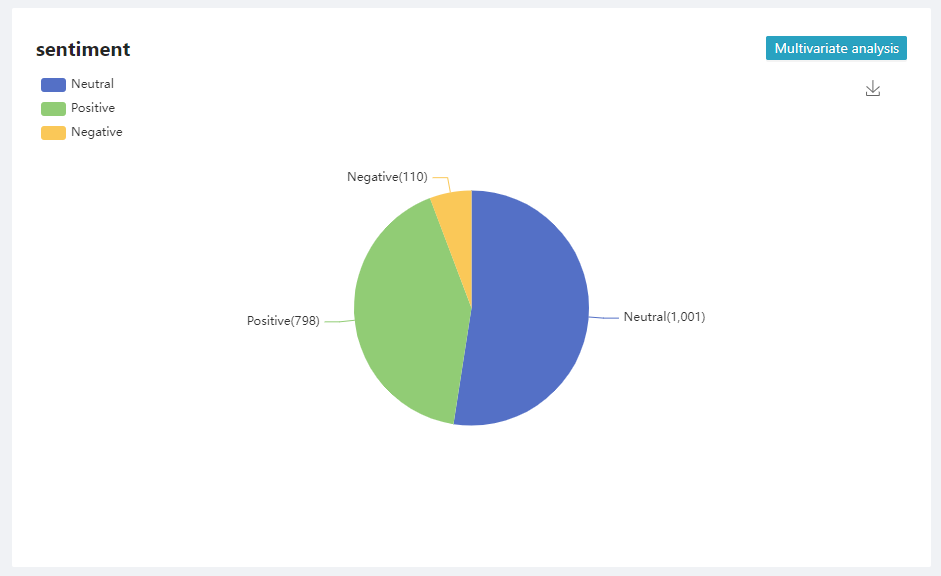
- 2. View analysis results: Click “View data”; enter the task details page to view the analysis results.
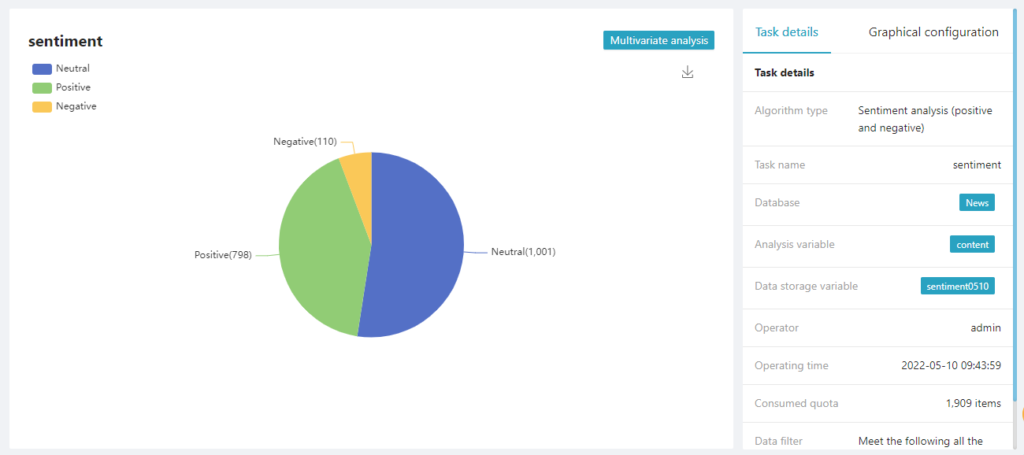
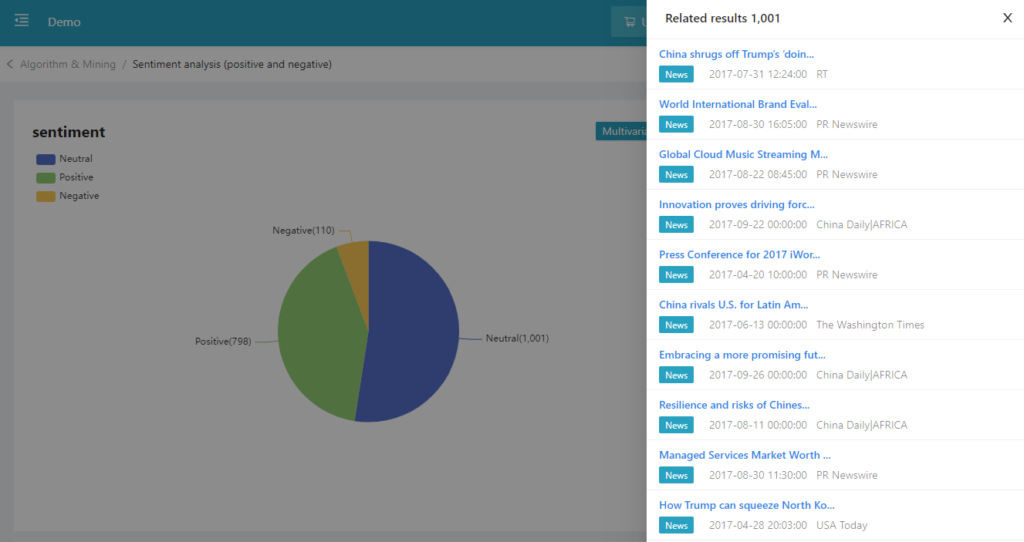
Tips: click each block of the pie chart to go back to the original data.
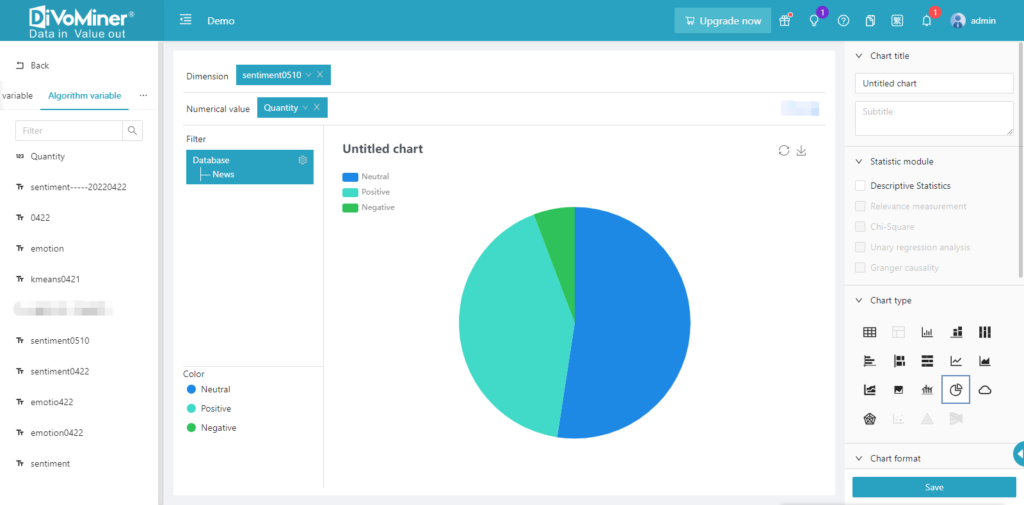
- 3. Multivariate Analysis: click “Multivariate analysis” to cross-analyze the algorithm results of sentiment analysis with other variables.
Glossary:
- Analysis Field(s): the field(s) that the algorithm targets to execute the analysis.
- Data storage field: the field used to store the results of the algorithm, which can be cross-analyzed real-time with other fields.