On DiVoMiner® platform, projects are divided into learning projects (permanently free) and research projects (subscription). Both have identical functionality modules, with differences in data volume, category limits and associated account numbers.
- Each learning project has a limit of 1000 data items, 50MB file storage space, 10 categories maximum, 1 administrator account, and 4 coder accounts.
- In research project (standard), the data limit is extended to 100,000 items, file storage space is increased up to 10GB, the maximum number of categories is raised to 100, and supports 1 administrator account and 6 coder accounts. Check out subscription plans
You can choose different versions of projects based on your needs. It is recommended to first use a learning project to familiar with the DiVoMiner platform and its operating procedures. Then, you can purchase a research project to start your in-depth research journey!
Next, taking learning project as an example, we will give you a brief introduction to the basic operation process of DiVoMiner platform:
*For more detailed information, please refer to other parts of the manual.
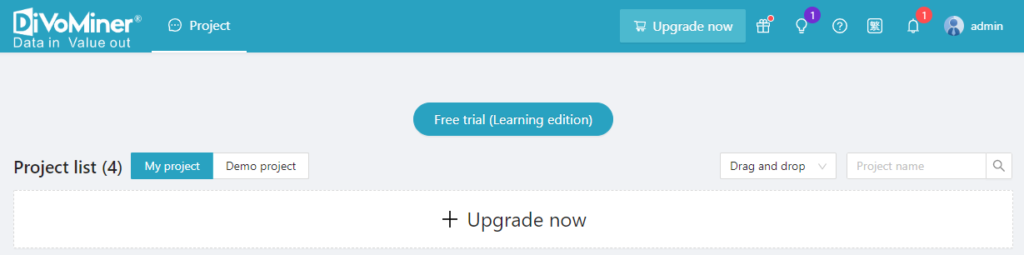
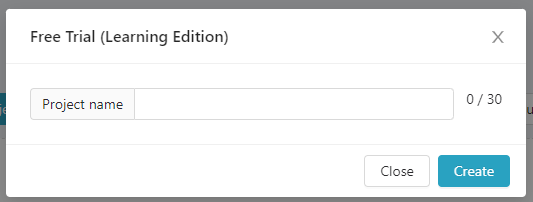
- 1. After logging in to the account and entering the Homepage, click [Free Trial (Learning Version)], edit the Project name and enter the Learning Project for further operation.
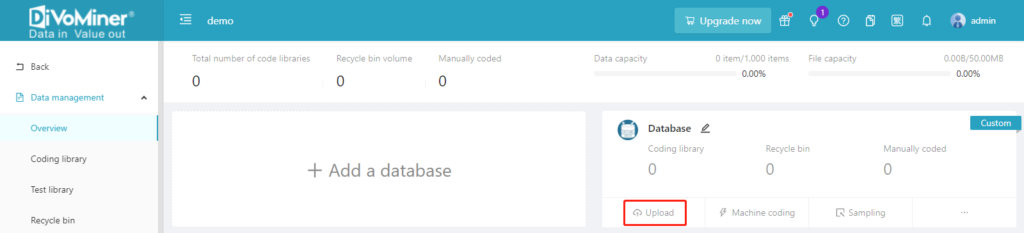
- 2. Create a learning project, then upload research data to the platform.
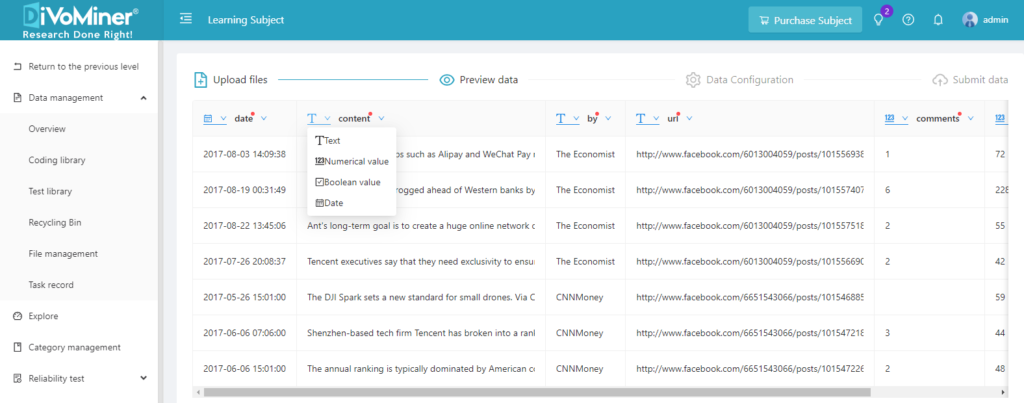
- 3. After uploading the data, proofread and revise the field type of the data.
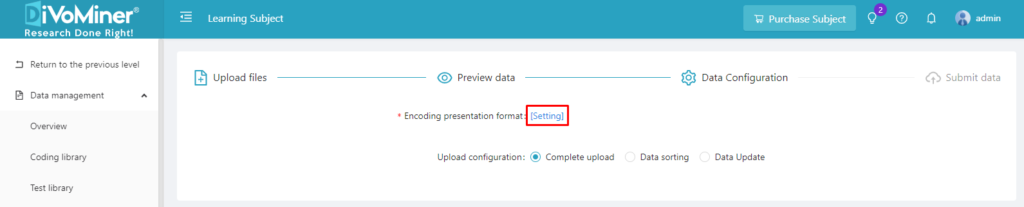
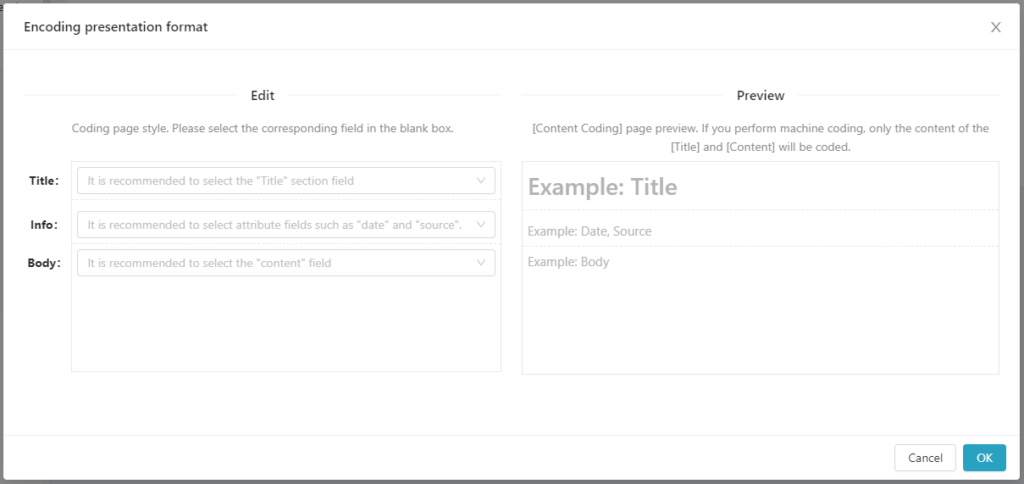
- 4. After the proofreading and revision of the data field type, set the configurations of the Coding page, which is to select the data content field in the corresponding area.
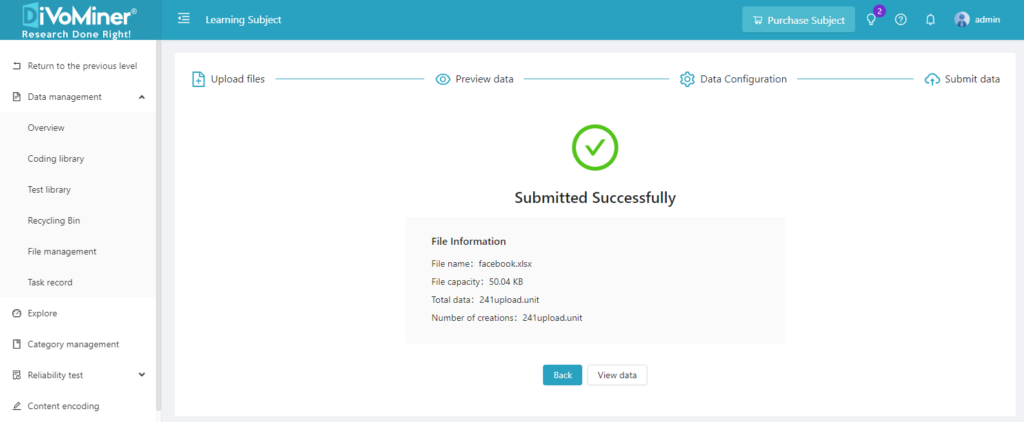
- 5. After setting up the Coding page, click [Submit data], and the data will be uploaded to the platform. Click [View data] to view the data details in the [Coding library].
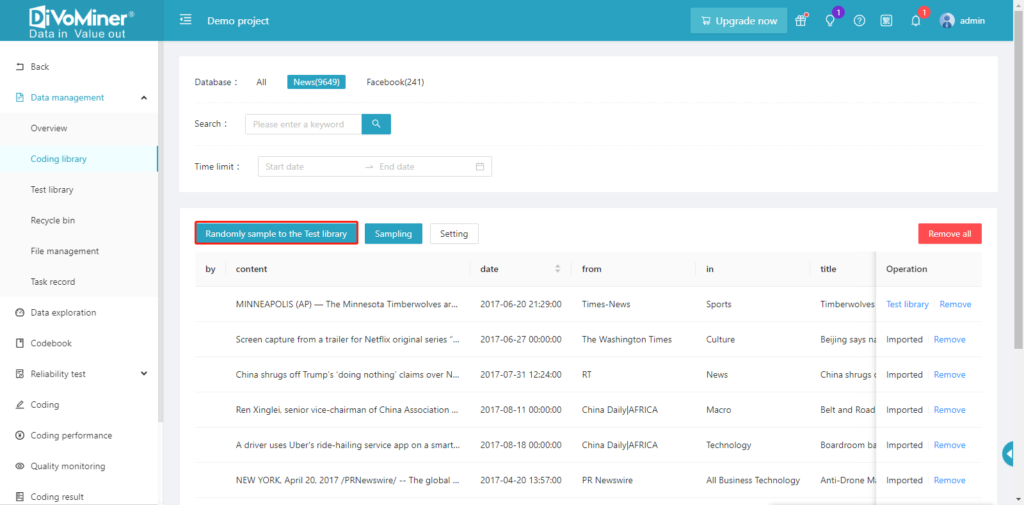
- 6. Import the uploaded data randomly into the [Test library] for the coding pretest.
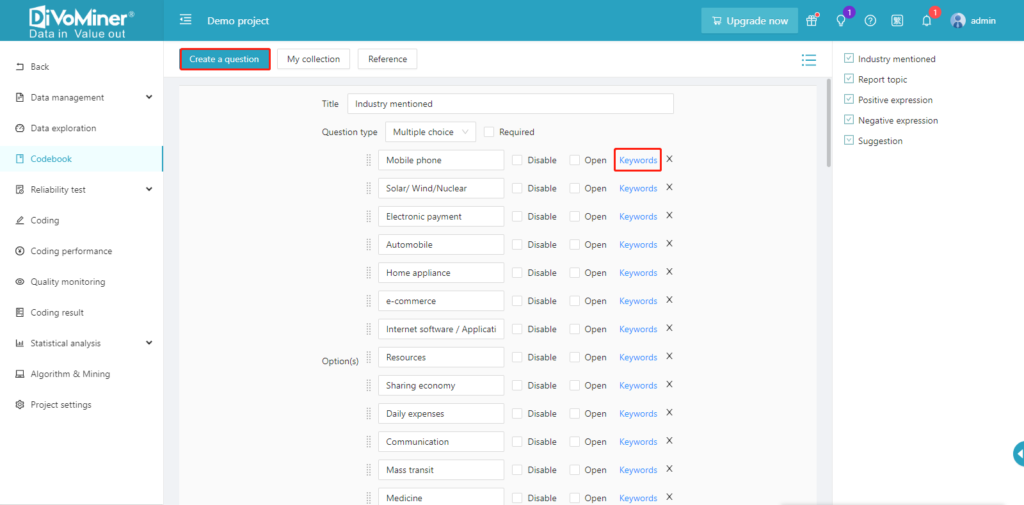
- 7. After the data import, click [Create a question] on the Codebook page to start creating codebook, and click [Keywords] on the right side of the questions to set keywords for the options.
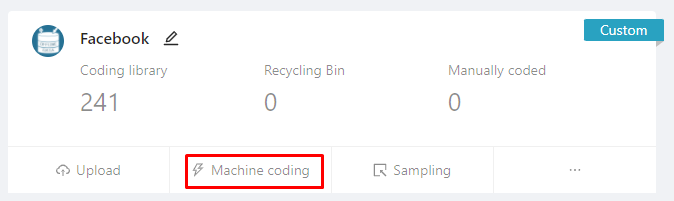
- 8. After setting the keywords, go to the Overview page and click [Machine Coding] of the corresponding database to execute the machine coding of the data.
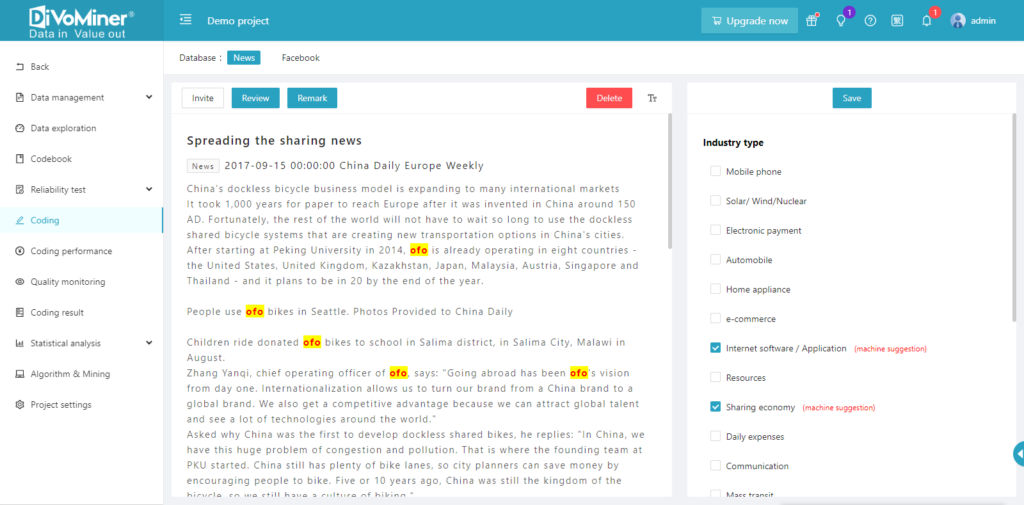
- After the machine coding is performed, code the text on the content coding page. The answer labeled [machine suggestion] in the options on the right is the result of the machine coding operation.
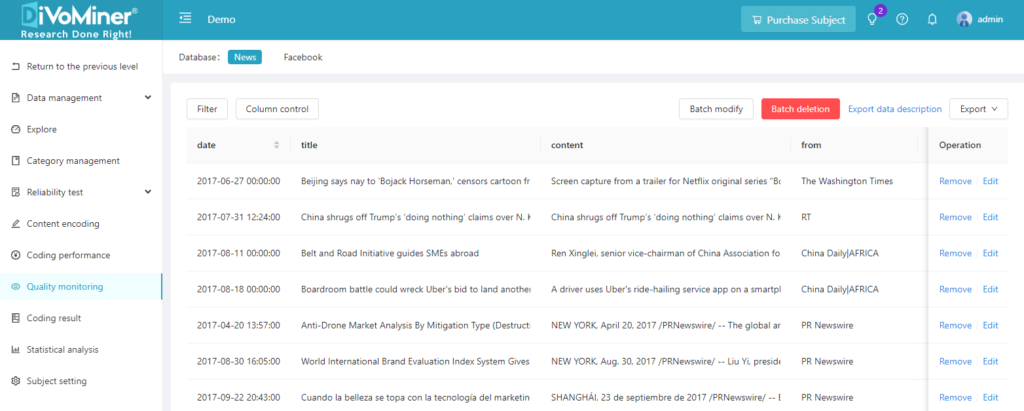
- 10. After completing the coding task, you can view or correct the coding results in the [Quality Monitoring] page.
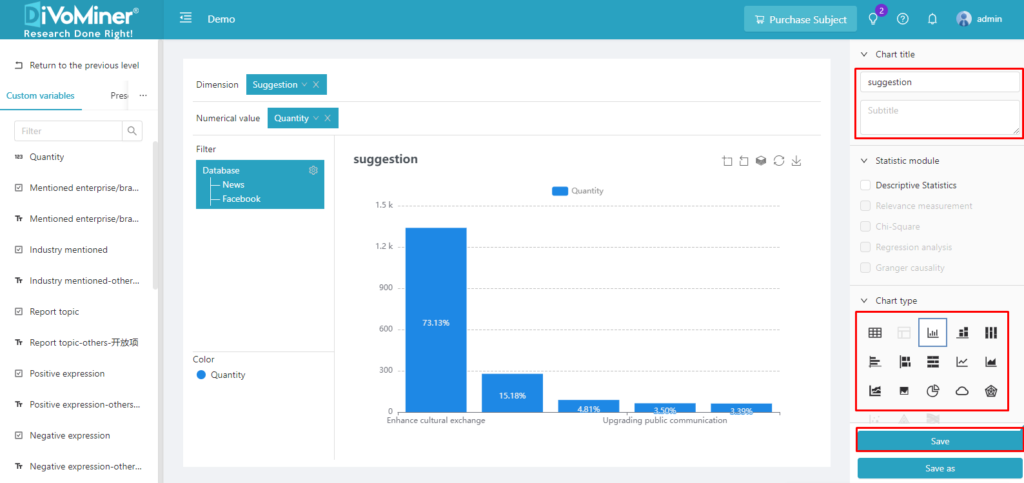
- 11. After correcting the coding results, you can click [New Chart] on the [Statistical Analysis] – [Basic Statistics] page to create a chart of the coding results.
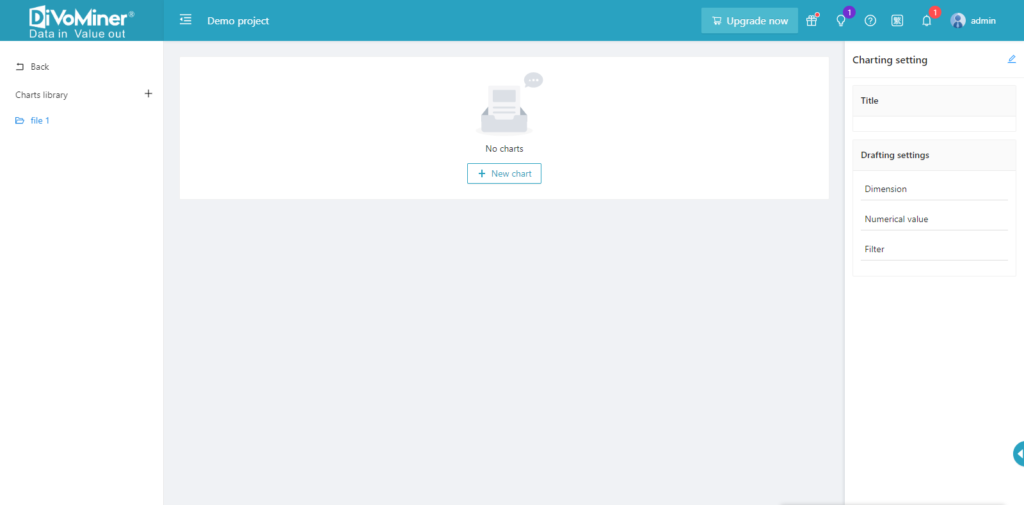
- 12. Drag the variables in [Custom Variable] and [System variable] into the corresponding dimensions, select the chart type, name the chart, and finally save the chart to complete the creation.