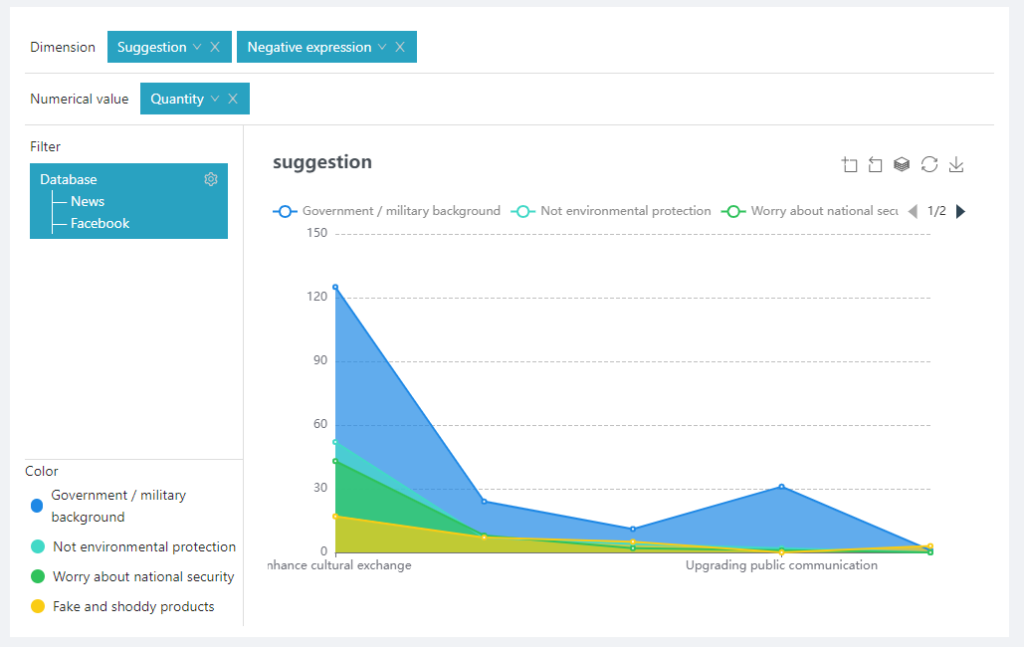
An Area chart is a type of line chart, but the area under the line is filled with color or texture. To draw an Area chart, first mark each data point on the Cartesian two-axis coordinates, then connect them with a line, and finally fill the space below the line. Like a line chart, an Area chart can show the change and development of quantitative values in a certain period of time. It is often used to show trends rather than specific values.