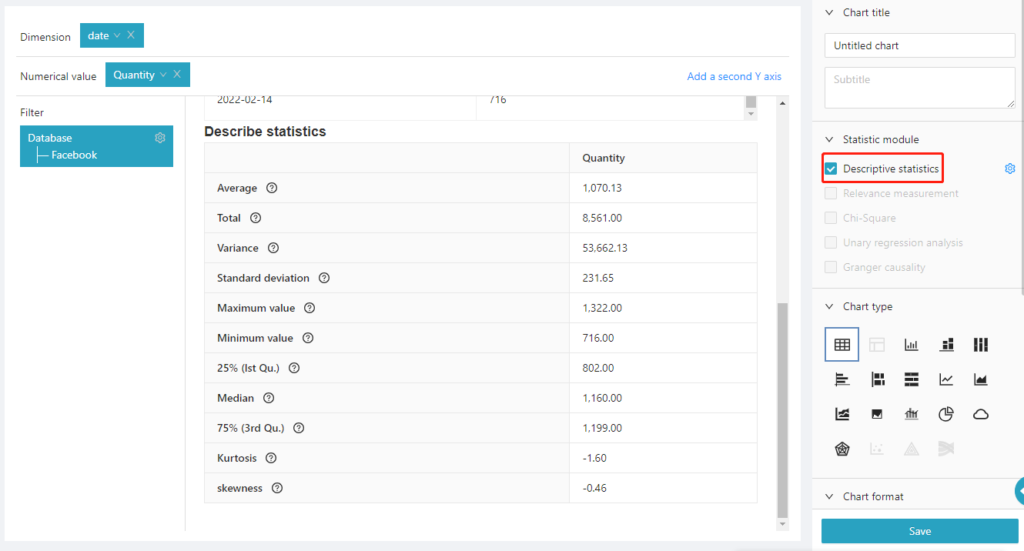
Descriptive statistical analysis is used to analyze the central characteristics (e.g. average value) and volatility characteristics (e.g. standard deviation value) of the data. The platform also provides statistical values such as maximum, minimum, median, kurtosis, and skewness. Descriptive statistical analysis is usually used for basic understanding of the research data analysis, and the average value is used to express the overall attitude towards the data scale and measurement.
Drag the variable to the “Dimension” and “Value” column; select the descriptive statistical result, and the statistical result of the variable will be displayed at the bottom of the chart.

